Monday, 28 July 2025

Oracle23ai - a SQL-Macro for Epoch - The Better version.

TL;DR: I had a function to produce "Epoch", similar to python. When I tried to speed up function-calls by using a macro I found an interesting side-effect. Macros are "substituted into the statement", and that has consequences.

Spoiler: You Should RTFM (link) before building Macros.

But in the end: I got it to Work, and Arguably Much Better.

Image: a camera with a Macro-Lens - nothing to do with SQL-Macros. But that lens also peeks at details.... 


Background: a function, then someone suggested an SQL-Marco.

Originally, I wanted my RDBMS to produce epoch-values similar to python, with the epoch-seconds, and fractional values to supposedly measure milliseconds and microseconds, if possible.

Due to the nature of the function-call, with use of the function in queries the resulting epoch was not Atomic: multiple occurrences of the function would return different values, as each call would happen at a slightly different point in time.

When I was playing with the function to get "epoch values", several colleagues suggested I should turn it into an SQL-Macro because that would be even Faster.

So I tried that "macro" idea. With mixed results. But I think the End-Result is Better than the function.


Just add SQL_MACRO ( SCALAR) ?

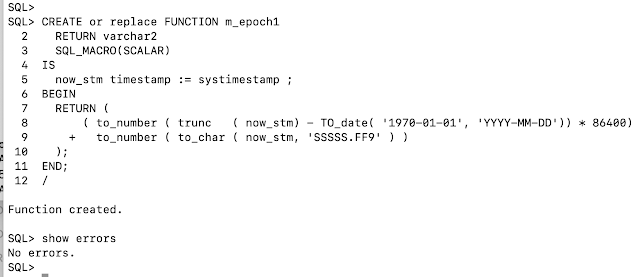
I took the source code for the function from the previous blog (link), and tried to turn it into a macro. Called it m_epoch1 (suffix the number 1, because I did expect to do a few tests/attempts, I was right). First Attempt:

Error: a macro has to return characters, not a number. I didnt think long, and just put in VARCHAR2. That worked:

Didnt think much of it, I assumed any necessary conversion would happen automatically. And I would check formats etc. later. (I would regret this..)

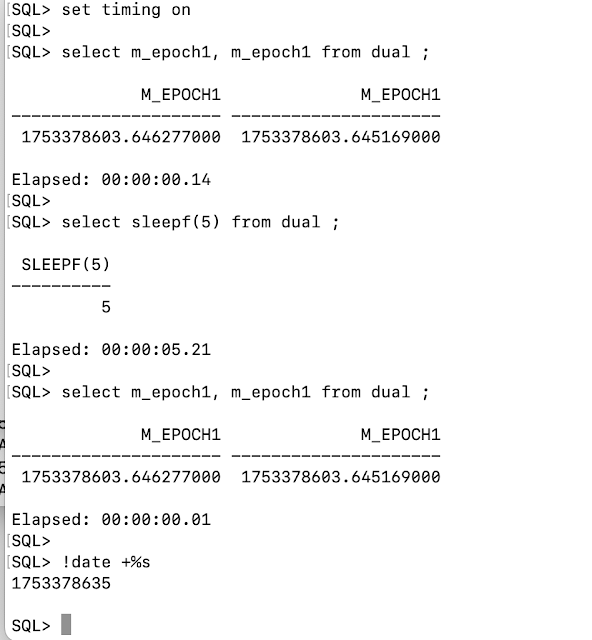
The usual test at the bottom of the source-script was a bit funny. The resulting values looked ok at first, close enough to the values from python time.time(), and close to my unix date +%s. But something didnt seem right. This is what my tests looked like:


The front-terminal shows a few queries using SELECT m_epoch1, and I tried the date-command straight away. The top-left terminal also shows the result from python. The value produced by python. At first sight, all looks reasonable.

The python value is typed about 6 sec after the linux-date. That was to be expected.

But the results from both of the SELECT queries show All The Same Values. And the values are about 140 seconds Older ???  (I did Not wait 2min in between....).


Something is Wrong...

I tried a more simple test: 2 identical selects with a deliberate sleep of 5 seconds in between, but the results, the epoch-values, of the 2nd run of the same query are Identical to the earlier call...


That Is Definitely Wrong. 

Same epoch reported by 2 queries, 5 sec apart.. ?

I did several more test-queries, even comparing results from function and macro in the same query. A lot of results didnt make sense. I started noting...

Firstly, every query, every column, every call to the macro/function used to yield a slightly different value (as it did with the original function). But with the SQL Macro it does Not ??

Secondly, some query-results seem to remain constant over time. But not always...??

Thirdly, the values now seem to increase from Right to Left, where similar tests with the function-version, f_epoch, evaluated from Left to Right. 

Fourthly, the values remain the same over the Rows of a query, e.g. subsequent rows do not seem to get later epoch-values, as they did with the function f_epoch. 

Fifthly, I found that when re-run an Exact query, the same answers come out. E.g. it looks almost like there is a result-cache for the queries.. (I didnt have a result-cache configured, that I know of. I even checked, as I have presented and blogged on that result-cache topic back in .. ah .. 2016 - link

All rather funny behaviour from the "macro" version.

I did several things: I started Reading the RTFM on SQL-MACROS (and the blogs by Tim Hall, sometimes dubbed as "The Better Manual"). And I asked some Oracle-Knowledgable Friends on slack about behaviour of SQL Macros. And within minutes, Erik van Roon, who has done several ppts on macros (link), had the clue...


The Solution: SQL MACROs are "injected" at parse time.

Erik's reply was: "If you get Constant-values from an SQL Macro, you do something Wrong. The Macro gets evaluated at Parse Time, and Only at Hard Parse."

My Lightbulb Moment... 

That explained most of my funny results. The macro inserted a "constant" value at (hard) parse time. and that value, the epoch-time at hard-parse, remained with the query, until the next hard parse.

Tim even shows how you can do a. 10053 trace and see the query-after-the-macro. And in my case, my sloppy-written macro would "inject" the epoch-value written as a string representing the litteral number. And that litteral would stay their until the next hard-parse.

For my solution, I had to go back to the manual and learn how to properly write an SQL MACRO...


It is the q'[ Quotes ]', Stupid !

Here is how my good, Working, version looks now:

By returning the part in the q'[...]'  it gets "injected" into the statement. And now the results are more promising.

Verify: Repeated, identical queries should return increasing, epoch-values:

Looks good. Now, every execute of a query gets a fresh epoch value.

Now Verify Atomicity: Multiple epoch-columns in a query should return same epoch-values for all calls to the epoch:


Correct! All epochs, regardless of row or column, have the same value. 

And the fractional seconds show that the epoch corresponds to SYSTIMESTAMP for the query.

This is actually more like the behaviour that I would want from an epoch-function in SQL. 

In short, I think we just Improved the Correctness for our Epoch.


Further research: Later...

So we improved on the "epoch", and I would recommend using the SQL Macro here whenever possible. ... Unless (like me sometimes) you were interested in some kind of "precision measurement" during the execution of the query. 

Just let me show you this:


Every Row in this SQL does two calls to the function f_epoch, and also displays the value from m_epoch2 and the factional seconds from SYSTEMTIMESTAMP.

Notice how the values of m_epoch are slightly earlier than the values from f_epoch. The m_epoch got inserted at the start of the query, together with the timestamp. But the f_epoch values got added (called) as each row got produced, and are thus a little later. This gives us some insight into the processing of the query. Might be interesting for some research. 

Maybe Later.


Speed Test: how long does it take...

As with the function-versions of the epoch, I did some testing with large-ish numbers of calls/records/queries.

I watermarked the SQL in the test with comments.. For example /* tm1.1 */ : It will query with 1 column-value of m_epoch, and get 1000-rows (connect by <1001)

And then tm1.2, tm1.3, tm1.4, tm1.8 : Ditto with 2, 3,  4 or 8 values in the row (more use of macro, more use of systimestamp...).

Those could be compared to similar calls to the f_epoch, the function from the previous blog, where I used  tf1.1 and tf1.4

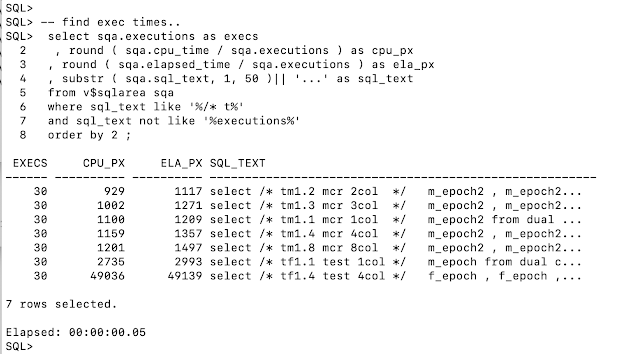
The results:

First look shows: the SQL Macro outperforms the function-call. 

Even getting 8,000 epoch-values (1000 rows, 8 columns, /* tm1.8 */ ) using the macro, is faster than getting 1,000 values from the function in query /* tf1.1 */  ... 

This makes sense: every f_epoch is a "separate call", whereas the m_epoch is inserted at the start of the query, and requires "no further calls".

Remember: we found about 8microsec per call to f_epoch, which still +/- concurs with the numbers in the results for /* tf1.1 */ and /* tf1.4 */ in this test. 

The values for the queries using the macro for 1, 2, 3, 4 and 8 columns are so close together that I dont want to do any calculation on those yet. 

There was however 1 consistent anomaly: it was strange that the 1-column resultset  ( /* tm1.1 */ ) should consistently be slower than the queries with 2 or more columns. Later!

(the above test is done using script tst_epoch3.sql, link below)


Yep, The SQL Marco is Fast....

Just to dig a little further, I tested with more rows and columns.

I also tested with and without set termout-on/off: the termout had no impact on execution-times, but made my tests go smoother, because I didnt have to wait for the endless scrolling terminal.

Because the epoch-value seems too get "fixed" at (soft)parse time, and the number of epoch-columns seems to have little impact, I varied the number of rows as well, 1000, 2000, 4000, 8000 (test in script tst_epoch4.sql, link below):

Interesting, but somewhat expected: The number of Rows now determines the (cpu) time the query consumes. The fastest group of queries is the one with 1k-rows. Even if the 1000 rows contain 8 epoch-columns (test tm1.8.1), producing those 8000 epochs is a lot faster in 1000 rows, than it is in 8000 rows x 1 column: test tm1.1.8.

The blue line indicates the jump from 1k records to 2k records, and the first jump-increase in cpy_per_exec.

And notice that in general, the use of the SQL Macro is much faster, and more "scalable" due to a lot less activity, than the conventional function-calls from the earlier version of f_epoch

Conclusion so far: That Macro Flies !    ( ... in this case)


About that anomaly... Parsing ? 

In the process of testing, I accidentally found the (probable) cause of The Anomaly of the First Query: at the bottom of the timing-results we see the exec-time for a manually done, one-time SQL: 

select / tm0 1st macro */ m_epoch from dual ;

This query appears on the last line of the test-results above, and it has only been called Once... 

By doing that one-call, the First Call, to the macro (after shared-pool-flush, or after re-create), I seem to "prime" or Parse the SQL Macro. If I leave that out, the first query in the test-series takes much longer on the first run, and that affects the average for this query. This explained the anomaly for tm1.1 in the previous test...

Another Item "found", and something to inquire when I next meet People Who Know Much More then me..


Wrapping it up: The Macro is The Better Version.

About the SQL Macro: I think that In This Case, the use of the Macro is more appropriate than the function. Especially as I gave some warnings about "Atomicity" in the blog about the creating of the function (link). But if you want to measure "inside the statements", then the function-version is what you need. 

The speed-tests show that the use of SQL Macro here also makes a difference. 

The anomaly I found on "first call", and where I worked around with a manual one-macro-call query, is probably explicable, but I dont have the inclination to read- or dig-deeper on this Right now. Later.

I'll put links to the source files below so you can do your own replay of some of this.

Remember: the Best re-use of code is once you have typed it yourself... 

Enjoy!


-- -- -- -- -- End of this blogpost, for now -- -- -- -- --

Appendix: Scripts.

mk_epoch_macro.sql : creation of the macro and some first-tests.

tst_epoch3.sql : testing to compare macro and function.

tst_epoch4.sql : testing with less and more rows.

-- -- -- -- -- End of this blogpost for Real -- -- -- -- --

Thursday, 24 July 2025

Oracle23ai - get the Epoch (like python and linux).

TL;DR: Using Oracle23ai and python, I wanted an SQL-function to produce the "epoch" value similar to a python call to time.time(). And of course I wanted the fastest possible version...

Oh, and a note on "Usage": Preferred usage is in a CTE... You'll see.


The image is an atomic clock from the National Institute of Standards and Technology (NIST). One of the most Exact Clocks in the world.


Background: Using python time module for measuring time.

From the unix "date" command, we can get the epoch, which is defined as the number of seconds since 01-Jan-1970 (link):

date +'%s'

That number looks familiar to anyone who has used epoch-values. And now we have python, it tries to do better and adds the fractional seconds to that value:

time.time()

Having such precision was very tempting. It was much more precise than the old-fashioned SYSDATE that I used in most of my legacy-scripts. And since way back in version 9i, Oracle has SYSTIMESTAMP, which is potentially accurate to the nanosecond (link to Oracle doc)

Here are three terminal windows to compare the options :

At the top, the terminal window shows the unix/linux-date, it returns whole seconds, with no factional component.

Middle-window: Python pretends micro-second accuracy (and the time-module even has some nanosecond-functions if/when the hardware supports that accuracy).

Lower-terminal, SQL>: Oracle _can_ do fractions of a second up to 9 decimals with the FF9 format-mask, but it is actually more like 6 decimals, e.g. microseconds. Still not bad.

So with SYSTIMESTAMP, the basis is there to build a function that produces the same kind of number as python: a floating point number of epoch-seconds, with decimals that go down to milli-, micro-, or even nanoseconds.


The function: use SYSTIMESTAMP to produce an epoch number.

My first attempt was relatively simple and explicit: Calculate the large nr of seconds up to today-midnight, then add the (precise) number of seconds (and decimals) that have passed since midnight. Call that version one, f_epoch1

Note that I use a two-step process, because TO_CHAR does not have a format-maks that covers "epoch seconds" (not yet?). 

First I calculate the nr of Seconds from Epoch up until midnight-today. 

And then I use a format mask to determine the number of seconds (with fraction FF9) from midnight up until Now.

Adding the two gets me the Epoch, with fractional seconds, similar to python.

And that seems to come out nicely. Here are the first tests:


Notice the first query: select f_epoch1 from dual. Seems fine, and the value is close to what my linux date +%s command produced. 

Now notice the second query, multiple-columns and multiple-rows query: Selecting multiple f_epoch inside one query yields Different, Increasing, values for the epoch. The function is evaluated multiple times, and the order is from left-to-right and from top-to-bottom.

This May be Counter Intuitive, and even Un-Desired ! 

Remember that SYSDATE and SYSTIMESTAMP are generally Atomic, immutable, during the execution of query.... More on that in a moment.

For the moment we conclude that every column in the query seems to be a separate call to the function, and yields a different (fractional) time

I did a python-call to time.time(), to compare outcomes. You can see from the epoch-values that I took me approx 5 seconds to type the python-commands.

This all Looks Promising: I can get an Epoch-value.


Preferred Usage: in a CTE (With epoch AS...)

Some people will not like the fact that the results of the function varies per row and per column. We are used to SYSDATE and SYSTIMESTAMP being "constant" inside a single query. 

To this end, I recommend to use the f_epoch in a CTE expression so as to ensure there is only One call, and the value will be "constant" inside the query that uses it.

Here is how I intend most usage:

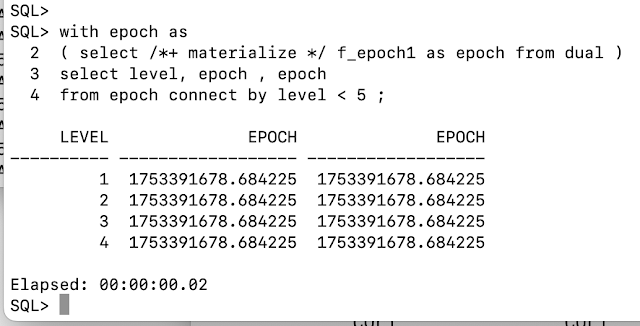
Notice how all the epoch-values are now Atomic, identical. And the MATERIALIZE hint is used to ensure the CTE is evaluated Before the main query, and only Once.

If an Atomic Epoch is what you want / need / expect, you should to be Aware of this! 

(there is no relation with the atomic clock in the image above, but still...)


Testing: Execute it a few thousand times...

As Oracle-geeks, we are obsessed with "performance", and the first thing I wanted to know: how fast is this. Or: how many CPU-(micro)seconds is this call going to take.

Here are some queries that call this function 1000s of times...

The first query, labelled /* t0 ...*/ , is the 0-measurement, included for calibration purposes. It does not call the function, but should give us an idea of the overhead for a query that returns a number similar to the epoch.

The other queries call the function with one or more columns. Running these queries multiple times should give us an idea of how long a call to the function takes. (I suggest 10+ runs to get rid of the parsing-overhead).

We run the tests 10s of times, and check the CPU- and Elapsed-times in v$sqlarea with the following query:

The zero-query takes 955 microSeconds to return 1000 rows. That is roughly one microsecond per number-returned. Consider this as "the overhead".

The query with 1 single epoch-column  takes 20,979 microseconds to return 1000 epoch-values, roughly 20 microsec per epoch-call. This is an upper-limit for the time we should find for a call the function.

The query with 4 epoch-columns takes 67,479 microSeconds, e.g. some additional 46,000 microseconds more to return 3,000 additional epoch-values. That would put the call to the epoch-function at between 15 and 16 microseconds.

The other values confirm this: the average call to the epoch-function is in the order of 15 microseconds. 

Not Bad for Oracle running in a container on an old macbook-pro. But I had to try a few more things to try though: Reduce the code, and use Pragma-UDF


Improving: reduce the code.

First, as an old-hand-coder, I tried to reduce the number of statements in the function. I eliminated the assignment to variables and the sum of two values. With some shuffling, I could get the whole function to be one single return-statement. Call that f_epoch2:

Compared to the original, I have eliminated three variables in the declare-section, and the equivalent of 2 lines of code in the function-body.

After verification (the results still came out correct...), I could test with that new version and it was slightly faster. 

Small Victory.

But there was more to try.


Improving: PRAGMA-UDF

When you RTFM on the use of stored-functions the standard tip is to use PRAGMA UDF (link). This should tell the compiler that you want to use the fucntion in SQL-statements and the compiler will try to optimize for that. 

Hence I tried this. The same, reduced code as version 2 but with added PRAGMA UDF, and called it f_epoch3 :

And while I was looking at the code, I tried a few more things, especially around the placement of SYSDATE and SYSTIMESTAMP. I figured the less calls the better, so I came up with this:

The function now does only 1-single fetch of the SYSTIMESTAMP, and no more calls to SYSDATE. On first test, this also seemed to work well. 

I now had done my compulsory "tuning + improvement" activity.


Time to Race: which version is fastest...

Every function got called in two queries and each query returned 1000 rows. 

One query would return one single column (e.g. 1000 calls to the function) and the other would return 4 columns (e.g. 4 calls to the function). Here are the results..

The numbers are never  exactly the same on every test, but the results (on the same machine) are always around 5-10% similar. And the order of the versions is Always the same: version 3b is the Clear Winner.

If we compare the queries t3b.1 and t3b.4, we can roughly estimate the time consumed for a call to f_epoch3b:

Every query returns 1000 rows, with either 1 call or 4 calls to the function. The difference between the queries is thus 3000 calls.

The difference in time per execute is 34,431 - 10,913 = 23,518 microseconds.

That would put the time for 1 call to the epoch-fuction at about 23.5 / 3 = approx 7.9 microsec. An improvement over the original version.

Verdict so far:  8 microSeconds to return an Epoch similar to the python time-call.

(with supposedly micro-second accuracy, -smiley-, but not really...)


Wrap up: Got it working, and got some lessons.

I got the function to do what I wanted: produce epoch-values with a suggested precision, apparently up to 6 decimals, e.g. microseconds (but not really that accurate...)

And from the various versions, I picked f_epoch3b as the winner. The seemingly fastest of the variants, and I used that code to create a final f_epoch.

You should be aware of the (non) Atomicity of the function. And if you need an atomic epoch value in a query: use the CTE and Materialize it.

The measurements, for what they are worth, show that on this system (an old MBP from 2013...), the call to the function takes about 8 microSec.

Tweaking the code to reduce statements made it somewhat faster.

Adding Pragma-UDF Definitely Helped.

As a by-product, I re-used some code (ideas) to measure SQL-queries by picking data from the shared_pool. 

The code for the various functions, should you want it, can be found in the links below. 

I did also try to pack the code into an SQL-Macro as well (Macros are possible as from Oracle version 21c). That works, and it is Even Faster. But that had a side effects. Topic for another blog. Maybe Later.


-- -- -- -- -- End of this Blogpost, for now -- -- -- -- --


Appendix A: The Scripts. 

Feel free to copy and re-use. But dont hesitate to code your own. People tend to re-use code more if they have typed it themselves... 

mk_epoch.sql : Creating the functions. File contains all old test-versions.

tst_epoch1.sql : Some queries to measure time.

tst_epoch2.sql : Comparing v1, v2 and v3, with v3b as winner...

-- -- -- -- -- End of this Blogpost, for Real -- -- -- -- --


Friday, 18 July 2025

Oracle23ai and python - Roundtrips.

 TL;DR: I use Oracle23ai and python. Measuring the time it takes to call cursor-functions reveals when RoundTrips take place. It also shows how prefetch and arraysize affect the round-trips.


Background : Investigating RoundTrips.

When using python and Oracle, we ended up with some python code that did too many round-trips and investigated the behaviour. I'll try to demonstrate some of the findings.

Some of what I demonstrate is also nicely pointed out in The Documentation... I just confirmed it.     

For the demo, I use an instrumented copy of "do_sql.py", which allows me to easily send all kinds of queries to the RDBMS and observe the behaviour, notably the timings. 

Earlier work on this problem can be found here (link to Latency-blog). And one of the outcomes was that on that system, the average RoundTrip time was about 1.5ms.

Rolling balls  - waiting for all of them to roll down...


A program that measures running of Queries.

To experiment with queries and timing, I constructed do_sql_times.py (sourcecode in link below). It prints out timing-data (to microseconds, or µs) to stdout. And when retrieving rows from a cursor, it reports the nr of microseconds it takes to get/print every row. 

The essential python code looks like this:

This is the code to get cursor-data, with minimal extras and overhead. (apologies for the comments, I do tend to leave a lot of notes inside code...). 

The program (link to previous blog) can take arg1 as the SQL to execute, hence you can do...

python3 do_sql_times.py "select empno, ename, sal from emp " 

And Here is a demo-run retrieving the well known EMP-data :

Notice the following on the first 4 records:

The 5,517 MicroSec (5.5ms): time to retrieve and display the 1st row.

The 70 MicroSec: time to get/display the 2nd row.

The 1,713 Microsec (1.7ms) : time to get/display the 3rd row.

The 70 MicroSec: display of 4th row...

The display of all subsequent rows then takes less than 300 MicroSec, with most in the 2-digit range (e.g. significantly less than 1 ms)

If you re-run the program with the Exact same SQL-stmnt, the time for the first row tends to go down from 5.5 to about 2.0 ms. This is most likely the effect of the Parse (on first run) and re-use of the SQL-stmnt from the Shared_pool. You can confirm that by flushing sh-pool or running slightly different SQL-stmnts but I wont go into that detail now, maybe for later. 

In most of the following tests, I display "repeated runs" of the program with the "parsing effect" removed.


In Detail: First check for the Overhead...

To start exploring, lets first show the program running with 1 row from dual, like this:

_> python3 do_sql_times.py "select 1, 'one row' from dual " 

The program will report on various stages, like doing imports and defining helper function, and then starts the Main code. 

First part of stdout looks like this:

After the imports and definitions, the ora_login shows where the connection goes (yes, I still use scott/tiger...). 

Ora_sess_info then reports the session statistics right after login, so we can later discount those as "overhead" or "initiazation work". In most cases, the logon (Thin Mode here...) is 1-3 CentiSec of DB-time, 3 RoundTrips, 10 executes and 4 usercalls. 

The actual use of ora_sess_info adds 1 RT,  1 execute, and 1 usercall...

(Yes, you can use snapper-by-Tanel (link) or similar tools to observe a session, but I want my python-code to do its own reporting, independent of other tools. And I might add some of this stuff to In-Production-Running-Code later) 

Hence, at the point of creating the first cursor, we are at 2-3 CentiSec, 11 executes and 5 usercalls (also: see earlier blog, link).  

And most important (topic of this blog) : We now Know this program does 4 (Four) RoundTrips before arriving at the cursor. Keep this in mind for the next testruns.


In Detail: Test a Very Simple Query... 


The program is now ready to create a cursor and do some SQL. And using the same stmnt as above, this is how the data from the query comes out:
 

The retrieval of that one row took 2ms 

And only 1 RoundTrip: total 5 RoundTrips, minus the known overhead of 4).

Just to demonstrate the effect of "parsing", when I change the text of the query (add two Capital letters), that provokes a new parse, and the retrieval time suddenly becomes ... 


A whopping 4.8ms now. 

But still the same nr of RoundTrips.

I also added the "parse count (hard)" to the reporting of the stats. I can not quite prove-beyond-doubt, but given the reported parse, I am fairly sure this extra time is due to parse-time of the 'new' query. I notice the same effect on other queries: 1st run generally takes about 2ms more than subsequent runs of the Identical query.

And indeed, after re-running the same query again, time for first row goes back to about 2ms and no more hard-parse reported... I am now 99% sure this is parsing: 

QED.  

You can Check for yourself: link to programs below. Feel free to try it out. 

And... the "benefit of the shared_pool" is demonstrated again...

Also notice: the need for parse does Not cause additional RoundTrips. A cursor.execute of a qry does the necessary parsing and the initial fetching all in 1 call, one RoundTrip. The separate options to parse statements are something to verify later, but for now out of my scope.

(note to double check this with the docu, and with Christopher Jones at Oracle - there could also be some python-optimising going on behind the scenes)


Now lets retrieve more data...

Next is to try and retrieve more rows, and possibly see the effect on nr of RoundTrips and other time consumed. We already spotted 

The standard trick to get a series in Oracle is connect-by, and we start again with 1 single row:

We notice the same 5 RoundTrips as on the query to the DUAL table. And we know the rest of the program contains 4 Roundtrips. Hence, the execute of the cursor seems to have added 1 RT.

Now try 2 rows:

Suddenly we see 6 RTs. Minus the known-overhead of 4 RTs  this query now seems to have caused 2 RTs. 

The extra time needed to get the 2nd row was (only) 78 microsec. 

But notice the timing info on the prefix-lines (highlighted): After the 2nd row from the cursor it took ... 460735 - 459081 = 1654 Microsec (1.7ms) before the next empty line was printed-out. 

In the earlier run with 1-single-row, there are only 57 MircoSec for that interval. 

So, on asking for 2 rows, we already got an extra RoundTrip, and something consumed 1.6ms at the end of the cursor-for-loop. That was probably that RoundTrip. Remember from previous blog: on this system the avg RoundTrip was about 1.5ms...

It looks like after the two rows, there was a RoundTrip that resulted in (the detection of) End-of-Set.

Let's try 3 rows...


Still only 6 RTs (e.g. the query caused 2 RTs). And the 3rd row took reportedly 1857 MicroSec. But the detection of the End-of-Set took only (553- 472  = ) 81 Microseconds.

Now 4 rows, check the output:

Still only 2 Roundtrips (e.g. 6 minus the known overhead of 4). And the time between the last row and the empty line is only 72 Microsec.

When retrieving 10s of rows: no more "slow rows" and no more RoundTrips get reported. You can now maybe guess where the next additional roundtrip got in...

Yep, at row 103 (and another one at row 203):

Notice the number RoundTrips is now 3 (7 minus the overhead of 4). This next additional RoundTrip only gets added at 102-103-rows. And this probably reflects the arraysize (default 100).

NB: Of course I did confirm this also by explicitly setting cursor.arraysize on a few re-runs. You should try...


Wrap up : Prefetchrows and Arraysize.

These test-runs shows the effect of the cursor property: prefetchrows, default set to 2. But maybe not quite as I had expected. Fetching 2 rows still took 2 RoundTrips, probably because the session has to confirm There Is No Third Row (check?).

Then there is another Roundtrip every 100 records, caused by arraysize.

I did confirm this by playing with both prefetchrows and arraysize a while ago and watch the effects. For example, my tooling function ora_sess_info() has prefetch set to 20, to allow the anticipated number of records to be fetched in a single excute and for-Loop and thus only incur a One Single RoundTrip.

I suggest you read up on the relevant pages (link) and try it out for yourself.

From reading The Documentation on these topics, I Learned a few things, and I got a few ideas for "tuning" our applications. 

But one of the main problems (for me) is the processing of single-records or small set, either retrieve or insert/merge. 

If time + energy, I have a few more ideas for testing out. Later.

-- -- -- -- -- End of this blogpost, for now -- -- -- -- --


Appendix 1: links to Scripts.

do_sql_times.py : the program with timing-info added

ora_login.py : the login utility (uses dotenv) and the session-info.

prefix.py : contains pp ( *argv ) to print to stdout with timing info.

.env : used by dotenv to store + get credentials and other info.


Appendix 2: notes..

Check that the extra time on 1st row indeed is the parse-time (99% proven?).

Check that the extra RT at 2 rows is indeed to confirm End-of-Fetch.

Check for effect of size of cursor-results, notably large sets.

Check for vector-results: extra fetches? extra RTs? extra time ?  We rarely retrieve vectors. We store them, 1-by-1, with often multiple secs in between. The overhead of RT on vectors is not a big factor (yet??). Later!

-- -- -- -- -- End of this blogpost, for now -- -- -- -- --

Thursday, 17 July 2025

Oracle 23ai and python - Beware of Latency and Roundtrips

 TLDR: While investigating the combination of Oracle23ai and python, I stumbled across some test-code and findings that may be useful to others. Lets start with the Latency.

Aim of this exercise was to find "Roundtrip and Latency Overhead" for a given connection or program. Chattiness is damaging with high-latency connections.

Chattiness: Comic-character Achille Talon is Chattiness in Person (google him!)


Background: running python code.

In general: this "cloud-only" industry needs to start understanding Latency.

Most (all) of my python work is just plumbing to get data to/from the RDBMS. But in having some python jobs "deployed" into containers in various locations, I have to either prove or disprove that "Bandwidth" or "Latency" are problems. 

This turned into an obsession with Timing (link to previous blog), and especially Round Trips.

Spoiler: it is not often Bandwidth, it more often Latency and Chattiness... If you do enough round-trips, that latency adds up.

I've started carefully by measuring some response-times, and trying to get a grip on how latency (expressed as time, mostly milliseconds or microseconds).

(turned out to be more than one blog-story to tell. stay tuned..... ) 


Why measure all this..

If I can get there, my aim would be twofold:

1. Measure and Report the (average..) Latency or RoundTripTime for a connection between a specific app running and an instance.

2. Measure and Report the nr of Roundtrips for a given program, depending on the amount of data to process.

Knowing both values will help to decide on placement of components: how big is the impact of reduced latency, and help to predict runtimes. But these measurements should also stimulate coders to try to reduce round-trips.


Caveat: This is still Simple and very Basic tooling.

In the examples below I will use very basic, straightforward connections. Most of my tools are stand-alone and do not have (and do not want) the luxury of the Oracle Client Library. And I do not use (do not need...) connection-pools.

As I was (still am!) a python n00b, some of my code may seem overly simple to more experienced users. Quite often I discover that "my problem has been solved by someone else, 10yrs ago...". Feel free to let me know where I need to improve.


Connecting and first measurements.

To test things out, I used a copy of do_sql.py (links below) from an earlier blog, and some utilities I constructed for use with python to ease login and to report some statistics on the connected session. I defined some funcions:

ora_logon (): returns a connection (or kicks out an error if not...)

ora_sess_info ( some_conn ): shows metrics from the connection.

pp ( args* ) :  print output, prefixed with the sourcefile-name and a timestamp

In the my (test-)program, do_sql_mtrcs.py, I will first use them to do a Logon, e.g. open a connection, and report the metrics. Start of the program looked like this:

The first version of the program does nothing yet, it just logs on and reports session-stats. By reporting the ora_sess_info 3 times, I get an idea of how much overhead each step is. Mind that I have already optimised the ora_sess_info to do just 1 (One) RoundTrip and 1 sort.

The result on stdout looks like this:

The timing-info in the log-lines gives us the approximate times for each step. 

Notice that "logon", e.g. opening a connection (in my case thin-mode!) seems to take 3 roundtrips, 10 executes and 4 user-calls. Subsequent call to ora_sess_info () seem to take up 1 roundtrip, 1 execute and 1 user-call each. I did also verify that later by running the 1000s of those calls against a near-silent instance and check in v$sysstats and by running an AWR-report.

So now I know the overhead of my calls (and I put them in comments in the python source-code). In a later version, I might add more to "Measure + Report" information on a connection.

Caveat: Those overheads should be verified for other-versions and future-versions of the driver and of the database. In my case I only use the thin-mode at the moment.

Now the timings: 

For logon, the call to ora_logon() : 2.635146 - 2.485878 = 0.149268 seconds... Say 0.15 sec for an action that we know involves 3 RoundTrips.

The approx time for each call to ora_sess_info() is about 0.05 sec (50 ms...) for what we know involvers 1 RoundTrip.  

First rough indication: a RoundTrip is somewhere below 50ms, and probably much less because each of the calls involves the roundtrips Plus the actual query on the RDBMS, Plus the output to stdout and the overhead of the python-function calls.

How can we measure this better ... ? 


Ping to the Database

The python-oracledb (link) contains a ping function, which is documented to Explicitly do One Round Trip. In the same docu-page, you find the is_healty() function which does Not do a roundtrip, and does perform a full connection check.

I decided to do a test of 3 cases, of 30 seconds each:

1- Running an empty loop to see how much time my python code takes. Count the loops and find time-per-loop.

2- A call to is_healthy() to see how much time that would take (no roundtrip!). Count the loops, and find time-per-call.

3- A call to ping()to generate real real RoundTrip, count the loops and find time-per-RoundTri (and substract the time-per-loop to counter for python-overhead)

The code looked like this:


This function contains 3 while loops that will repeat an action for n_sec and report on the time + time-per-call.

I called the function with n_sec set to 30 seconds.. And the outcome was: 

The time per empty-loop was 0.000314 ms, e.g. less than a single-microsecond of overhead because of the while-loop.

And the avg time for a ping was 1.53 ms. The outcomes of several runs were consistent to 1 or 2 digits (on this system!).

Also check the nr of round trips reported by ora_sess_info () : 15156, which is exactly 3 more than the nr of ping-loops reported. This concurs with the fact that we noticed earlier: logon took 3 RoundTrips. We can conclude that both python (the n_count) and the RDBMS (from v$mystats) reported the same number of RoundTrips happening. And AWR confirmed this separately by reporting a similar number of RT and UserCalls on testing this program.

Confirmed: Each of those ping() calls did 1 RT and 1 UserCall.

The average time for a call to is_healthy() was 0.000680 ms, still less than a microsecond, very short compared to the ping and closer to the "empty loop", hence my impression that this function is efficient but definitely does not do a RoundTrip, e.g. not a complete Health-Check for a connetion (?).

At this point I have an impression that the RoundTrip to the database for this combination of app-platform and location is about 1.5 ms


Wrapping up: Roundtrips  x Latency = Time in the Nework

We can count RoundTrips from V$MYSTAT, V$SESSTAT or by analysing AWR. We have established a way to measure Latency between application and RDBMS from connection.ping(). It was approx 1.5ms on this system.

Once we have these numbers, we can start guesstimating the impact of network-changes or application-moves. 

A program that needs 1000 roundtrips to do its job, in a system with latency of 2ms, will loose 2 sec of real time just in the network. Any increase in Latency.. or a higher nr of RoundTrips will impact time needed by the program. 

By regularly measuring and reporting those numbers, we keep an eye on the impact or our network and the Quality of Service.

Notice that we hardly did any real queries yet. Next blogs will add a few more insights in the traffic between app and RDBMS.


-- -- -- -- -- End of this blogpost, for now -- -- -- -- --


Appendix: Links to scripts.

do_sql_mtrcs.py:  logon + get 1st metrics (.. it can do more, Later)

rt3_ping.py : try to measure the RoundTrips.

ora_login.py : utilities to logon to database and report v$mystats.

prefix.py : utility to prefix print with filename + timestamp to stdout.

.env : edit this file to include your own scott/tiger credentials.

You will also need python components : python-oracledb and dotenv, which you can pip into your system.


-- -- -- -- -- End of this blogpost, for Real -- -- -- -- --

Tuesday, 15 July 2025

Oracle23ai : Measuring time more precisely, and observing my Servers.

 TL;DR: In a few old scripts, it was time to replace sysdate with systimestamp, for very geeky reasons. The reason to revisit these old scripts was to increase precision and to adapt them for use together with some python-code - More on that Later.

Oh, and I'll show how to check/verify the CPUs in a system (with a very old but simple trick).


Background: some old scripts, time to upgrade.

Since way back, Orale7, I had two scripts, and two similar functions: spin.sql and sleep.sql. The sleep.sql is evident: put a process to sleep for N seconds. The spin.sql would do the opposite: make the attached connection run full-speed, thus generating N seconds of load on the database server. Why these scripts... you'll see.

Note that I first created those as runnable-scripts, but very soon also as select-able functions for easy use in statements. I'll demo some of it, and I'll put the sourcecode in links below.

For "sleep", having a script provided very flexible: in cases where the execute-grant on DBMS_LOCK was not given immediately. It may even have started with just a host-call to the OS sleep program, hehehe. (Dear DBA, can I would like to have the following GRANTs..., approval could take a few weeks...).

But in the back of my head was always the nagging knowledge : those are not very exact. We Can Do Better...


Running the "old versions" of the scripts...

The lack of precision was notably on very short callsm and was often evident when I used set-timing-on:

You can see me running the script-versions of each. The sleep 1  and sleep 1.1 provide an elapsed time nearly Exact to the specified nr of seconds. The DBMS_LOCK.SLEEP is documented as 1/100sec precision and at the time that was fine.

But spin.sql, when called with various values, provides elapsed-times that are often less, but sometimes more (?) then the specified value.

And this is probably because start and end are measured in Whole-Seconds taken from the SYSDATE. So if you started a script or function at the tail-end of a second, you would loose the starting-part of that second. This was oracle7, remember.

But for spin.sql, or the call to the spinf() function, the actual "elapsed" time was never exactly the asked-for time, due to rounding errors on the "Seconds" of SYSDATE.

Also note: For the script-version of sleep, I would insert a host-sleep call if it was too complicated getting grant on DBMS_LOCK from the DBA (sigh..). The actual precision from a linux sleep call would be around 1/00 sec as well, often less precise due to various overheads. Still, at the time, that was good enough for me.

And normally precision was not a problem, as typical usage was for intervals of many seconds or minutes. Still, we could do better. And with the use python came the time module (link). Here, I suddenly got a system pretending to be nanosecond-precise with calls like time.time() and time.perf_counter_n () : Nanoseconds...! 


Systimestamp: FF9 measures down to nanoseconds (??).

Using SYSDATE short of shows the age of those scripts. And I didnt mind, I never had much need to get better accuracy than 1 Second anyway, sleep or spin. But still.... Since Oracle 9, there was SYSTIMESTAMP, which could be reported up to 9 decimals (e.g. nanoseconds...). Plus, in Oracle-18c, there was the more accessible sleep-function in sys.dbms_session instead of the old DBMS_LOCK (soon to be deprecated!). It was time to upgrade my scripts.

For starters, here is how I got the "epoch" out of my RDBMS:


(nb: geeks can now see or find-out when I wrote/tested this blogpost...)

So with an accuracy of microseconds, I could improve on the exact timings of those scripts ? 

And were these scripts of any use at all ?


Use-cases: CPU speed and nr of CPUs available.

Use-case 1: compare CPU-Speed.

Way back, the use of spin.sql was mainly play-time. See how I could "load the server". But very soon, The first Two serious Use-Cases popped up: 1- Get a feeling for the CPU speed by counting the nr of loops/sec. And 2- Verify the nr of CPUs in a system.

For an newly arrived Exadata, to replace our VMWare serverpark, we got asked: how much faster would this make "our application" ? The app in question was 92% or more just DB_CPU:

This application was Not doing typical database work and it was Not IO bound. It was purely CPU-bound. But a jump to next screen would take just over 30sec, all of it CPU-work on 1000s of function calls (dont ask..., I presented on this "performance problem" in 2015 or so...).

So on the old system, we ran "spin.sql for 30 or 60sec, and let it report the nr of (empty) loops, just to get a feeling for the speed. Then we did the same on the Exadata, and we got about 3x the nr of loops per sec. Hence our prediction was: this will _only_ give you about 3x increase but not more than that. And we were surprisingly close to the mark.

Use-case 2: check nr of CPUs

The other real-world story goes back to +/- 2008: Cstmer had a new Sun-M-series. The system was given on trial, and supposedly had 24 CPUs. Of course, I was curious how fast it would be, and how it would stand up to real Load. So I ran spin.sql and got back a nice, large number for loops/sec. And I could quickly run up 12 or more (putty + nohup) spin-scripts to the system and try to make it blow steam out of the serverroom.

With a 24-CPU system, I had expected my 12 scripts spinning away to load the machine to about 50% (or more). To my surprise, it only loaded up the system up to about 40%. Either this system throttled my jobs, or we had more CPUs...

Testing with 4 spinning scripts: about 13% load

Testing with 8 spinning scripts: about 27% load... I could see a trend.

When I showed this to the sysadmin, he was surprised, but went off to do his own verifications. About 30min later he came back: Dont Tell anyone, but we have 32 CPUs in the box. They probably forgot to "disable" 8 of them... He went back to his cubicle a Very Happy Man.

Note that with many system having the cpu_count set to something lower than the actual machine-capacity, this trick has become of limited use, and your test will get strangled by "resmgr: cpu quantum" (if your DBA was vigilant..)

But at the time, I think Oracle version 10.2, I was kinda Surprised at what my little playful scrippie had unearthed...


Now for Modernising... Functions, and more Precision.

Since python has a set of time-functions (link) that pretend to do nanosecond precision, I wanted to try and pair my Oracle-scripts to that. Although most Oracle implementations seem to stop a microseconds (given fractions of Seconds as : .123456000, where the zeros are the 999 nanoseconds).

So I considered it time to rework my scripts to do similar. I started by creating functions rather than scripts. From the code of the existing scripts, I created functions spinf (n_sec) and sleepf (n_sec). This meant I could also put "spin" and "sleep" into SQL queries. A bit similar to what a competing RDBMS also does (link? nah..).

The sleepf remained at Centiseconds for the moment, as both DBMS_LOCK.SLEEP (soon to be deprecated!) and DBMS_SESSION.SLEEP are documented to be up to 1/100 of a sec.

The resulting functions are defined in the sourcefile mk_spinf.sql (link below), and they can be uses in queries. Here are some examples for spinf:

Notice the results are still "inaccurate" at low values because of the use of whole seconds (from SYSDATE accuracy). The request to spin 1.1 second resulted in a spin-duration of 1.5 seconds, and the resulting loops/sec is estimated too high.

Of course, we can have the imprecision "averaged out" by using longer intervals, as was the habit with the old code anyway. But still...

So the next version of the function was spinf_ns, where the suffix _ns would suggest the nano-second precision, similar to the same suffix in python. Lets run it a few times..

Firstly, we did not get down to the nanosecond precision, not yet. But I kept the suffix anyway, bcse it looks good, and it is python-y.

But the actual elapsed time are quite close to the 1/100 sec precision now. And that is much better than before. 

I can now more or less control, specify, how much time I want as session to consume. I may use that to do some measurements later (future blog-plans...)


Similar with sleepf( n_sec ): allow for short powernaps, and verify.

While at it, I also created a function to sleepf ( n), where n can give you a precision of up to 2 decimals:

And voila, now the actual sleep-times are very close to the specified ones. You never know when it might be useful to slow down a query.


One more tool: Measure what my session did...

Just to top it up, I re-visited an other script as well: mytime.sql (link below). To report on the time spent inside the session. The view V$MYSTAT is a very nice way to see what Your Session actually Did. I've used that to see how much DB-time I have consumed (and roundtrips, and executes, and user-calls).

Here is how you can combine spinf_ns () and mytime.sql:

The first run of @ mytime . sql tells us the session has consumed 1,101 of DBtime (expressed in centiSeconds, so that would be 11.01 seconds). I then run spinf_ns to add 8.97 seconds of "activity". Taking into account the expected overhead of the "measurement", I should end up close to 2,000 centiSeconds (20sec). 

And as you can verify: That Worked. 

QED.


Wrapping it all up, future plans...

I have improved on my existing toolset. I have more precise instrumentation, notably to match the python tools (the ambitious _ns suffix). 

And I have a few ideas to put them to work by instrumenting my python- and PL/SQL code.

I plan to use some of this to investigate python-code, notably with regards to time lost in roundtrips. If I can get it all to work, and if it makes sense, I'll write up the results... (link to future blog here...)


-- -- -- -- -- End of this blog, for now -- -- 2 more appendices -- -- -- -- --


Appendix 1 : links to scripts.

sleep.sql : old script for sleeping N sec.

spin.sql : old script for spin, output nr-loops per sec.

mk_spinf.sql: create functions for sleep and spin.

dbtime.sql: report DB time consumed by the instance (since startup).

mytime.sql: report DB time consumed by the current session (since logon)

epoch.sql : my various attempts to extract epoch-seconds...

Feel free to steal and adjust for your own usage (the most re-used code is the code you write/edit/tweak yourself!)

And, Just Curious: how many loops/sec does your system get out of spinf_ns.sql ... ? Ping me the results if you ever run any of the spin-stmnts.


Appendix 2: More measurements: check the SLOB tool by Kevin Closson 

Over time, I have used spin.sql as basis for other scripts, notably to count nr-commits per sec and nr of Physical IOs. But because others did a much better job of determining these metrics, I've put those out of scope for now. Maybe later.  But you could learn a few things from checking the work of Kevin Closson (webpage-link) on the SLOB tool to benchmark Physical IO (github link).

-- -- -- -- -- -- End of this Blog, Really -- -- -- -- -- --


Monday, 14 July 2025

Oracle23ai and python - Just run this Query.

TL;DR: When I started to combine Oracle23ai and python, I wrote some Terrible pieces of code. One stands out as outright Dangerous (but Useful): How to Execute Any Select-Query...


Summary: Dynamic SQL, and Ad-Hoc queries.

I re-used the program victor.py (see blog last year) to run adhoc-queries: just give it a string of valid sql, and loop-print the results. Who needs SQL*Plus eh?

To copy this trick, you dont even need to download the file (links at bottom); you can almost type it faster yourself.

Up-front Warning: Do Not use this program (this trick) on Production-data. You will see why - and could be worthy of a whole separate blog...


Background: Do Some Queries...

My first steps into Python were focussed on "fetching data", e.g. SELECT, preferably in some SmartDB-way. That data got handed to PyTorch (link) for further processing. Soon after came the "insert of results". All very Basic, nothing fancy.
A need for debugging-inspection of (large-ish) vectors resulted in the program victor.py to fetch+inspect individual vectors (see earlier blog).

And as I experimented with the (interactive) program for vector-inspection, I "discovered" I could use the same program for adhoc query+display of regular records. That provided a nice playground to experiment. It also turned out quite useful for situations where python-access to the data was the easiest, or even the _only_ way to connect to certain schemas (dont ask, talk to our CISO...).


Return results of a query, simple...

You probably discovered for yourself, this here is the quickest way to verify a (select)query in python:

cursor = ora_conn.cursor()     

for row in cursor.execute ( "select * from emp" ): 

  print ( row)


You can even run queries "interactively" from the python-prompt, after you have opened the connection and defined the cursor:

>>>

>>> for row in cur.execute ( " select * from emp" ):

...   print ( row ) 

... 

(7369, 'SMITH', 'CLERK', 7902, datetime.datetime(1980, 12, 17, 0, 0), 800.0, None, 20)

(7499, 'ALLEN', 'SALESMAN', 7698, datetime.datetime(1981, 2, 20, 0, 0), 1600.0, 300.0, 30)

(7521, 'WARD', 'SALESMAN', 7698, datetime.datetime(1981, 2, 22, 0, 0), 1250.0, 500.0, 30)

(7566, 'JONES', 'MANAGER', 7839, datetime.datetime(1981, 4, 2, 0, 0), 2975.0, None, 20)

(7654, 'MARTIN', 'SALESMAN', 7698, datetime.datetime(1981, 9, 28, 0, 0), 1250.0, 1400.0, 30)

(7698, 'BLAKE', 'MANAGER', 7839, datetime.datetime(1981, 5, 1, 0, 0), 2850.0, None, 30)

(7782, 'CLARK', 'MANAGER', 7839, datetime.datetime(1981, 6, 9, 0, 0), 2450.0, None, 10)

(7788, 'SCOTT', 'ANALYST', 7566, datetime.datetime(1982, 12, 9, 0, 0), 3000.0, None, 20)

(7839, 'KING', 'PRESIDENT', None, datetime.datetime(1981, 11, 17, 0, 0), 5000.0, None, 10)

(7844, 'TURNER', 'SALESMAN', 7698, datetime.datetime(1981, 9, 8, 0, 0), 1500.0, 0.0, 30)

(7876, 'ADAMS', 'CLERK', 7788, datetime.datetime(1983, 1, 12, 0, 0), 1100.0, None, 20)

(7900, 'JAMES', 'CLERK', 7698, datetime.datetime(1981, 12, 3, 0, 0), 950.0, None, 30)

(7902, 'FORD', 'ANALYST', 7566, datetime.datetime(1981, 12, 3, 0, 0), 3000.0, None, 20)

(7934, 'MILLER', 'CLERK', 7782, datetime.datetime(1982, 1, 23, 0, 0), 1300.0, None, 40)

>>>


That was a Nice Discovery: once I had a connection-object open, I could just test queries from the prompt! But it can be a bit awkward if you are typo-prone like me...


So, why I wrapped it into a program...

Once I found myself testing queries that way, I came up with the little program do_sql1.py. It will prompt for a query, and try to execute whatever SQL was entered. And display the result line by line (or an error...). The result looked like this:


As you can see, the program opens a connection (using credentials from dotenv, see earlier blog), and it prompts the user for input of a query.

So let's give it a query...: 

select * from dept order by dname

I typed the stmtnt, and hit enter:


After typing a query and hit enter, on one single line, bcse sys.input(), I get ... results! And from the timing in the print-stmnts, I even get an idea of where the time is spent, something I could use later in troubleshooting.


[intermezzo] Instrumentation: filename and timestamp.

From the output above, you can see that I print the (source)filename and a timestamp in microseconds in front of every line. To do so I am using a self-coded module called prefix.py (link at bottom) which might also merit a mention in a blog sometime. Printing those timestamps sometimes reveals some of the inner workings (separate story, maybe later...). 
As I found: the time.perf_counter (link) from python tries to go to nano-second precision. Promising for future use...


More Usage by using Stdin and argv[1]

I quickly discovered that I could use stdin to feed it pre-edited queries. As long as the inputfile was a one-liner. And I also started detecting sys.argv[1] and use that as query to run. All still very primitive, but I found it usable for all kinds of debug-purposes. 

For example, typing:

echo "SELECT ename, sal from EMP order by ename" | python3 do_sql1.py


yields the results, to stdout, like this:


Looks familiar ?
And we begin to notice is the time-differences between the output rows. The nr of microseconds for the first row is 945422 - 937535 = 7887 microsec. Most of the subsequent rows get fetched in less than 100microsec (e.g. >10x faster), which is probably an indicator for work going on behind the scene, e.g. a round trip ? 


Wrapping up: Risky, but Much more Useful than expected.

Normally, I would be the first to say: What a useless- and Trivial program. 
Because as query-tools, SQL*Plus (link) and SQLcl (download link) do a much better job as adhoc- or Query-interfaces. 

Warning and Caveat,  Do I really have to say this Out Loud, again...:"
This little program is very similar to doing "SQL-Injection" - Be Careful!

But I found myself using this do_sql1.py a lot while tweaking and troubleshooting python-oracle programs. 

For one, I could run this program from any python-container to test a db-connection.
It verifies: Does the connection go where you think it should? 
It does testing: And I could test what a certain query would return in That Particular Container. This is how I find a container is accidentally connected to the wrong database, or wrong schema (yep... quite often!). 
And when I finally started reading the documentation for oracledb (link), this program proved easily-adaptable to explore various settings and options. In the end, it proved much more useful than expected.

As always, I dont think many of you will copy it as-is. But I suspect some of you have similar tools, or will build similar tools. And often the best re-use of code is from the code you typed (or adapted) by yourself. 

Have Fun ! 

-- -- -- -- -- -- End of this blogpost, for now -- -- -- -- -- -- 

Appendix: links to sourcecode

do_sql1.py : the actual program.
prefix.py : the module used to format + print output
ora_login.py : the module used to open connections, from earlier blog (link)

-- -- -- -- -- End of this blogpost, for real -- -- -- -- -- --