TL;DR: I had a function to produce "Epoch", similar to python. When I tried to speed up function-calls by using a macro I found an interesting side-effect. Macros are "substituted into the statement", and that has consequences.
Spoiler: You Should RTFM (link) before building Macros.
But in the end: I got it to Work, and Arguably Much Better.
Image: a camera with a Macro-Lens - nothing to do with SQL-Macros. But that lens also peeks at details....
Background: a function, then someone suggested an SQL-Marco.
Originally, I wanted my RDBMS to produce epoch-values similar to python, with the epoch-seconds, and fractional values to supposedly measure milliseconds and microseconds, if possible.
Due to the nature of the function-call, with use of the function in queries the resulting epoch was not Atomic: multiple occurrences of the function would return different values, as each call would happen at a slightly different point in time.
When I was playing with the function to get "epoch values", several colleagues suggested I should turn it into an SQL-Macro because that would be even Faster.
So I tried that "macro" idea. With mixed results. But I think the End-Result is Better than the function.
Just add SQL_MACRO ( SCALAR) ?
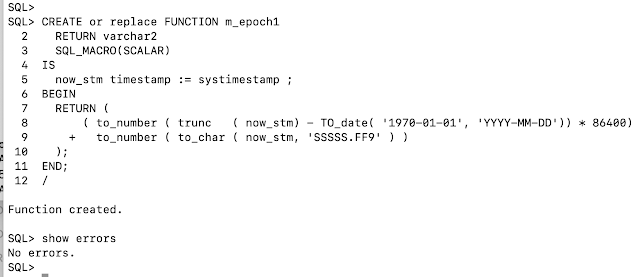
I took the source code for the function from the previous blog (link), and tried to turn it into a macro. Called it m_epoch1 (suffix the number 1, because I did expect to do a few tests/attempts, I was right). First Attempt:
Error: a macro has to return characters, not a number. I didnt think long, and just put in VARCHAR2. That worked:
Didnt think much of it, I assumed any necessary conversion would happen automatically. And I would check formats etc. later. (I would regret this..)
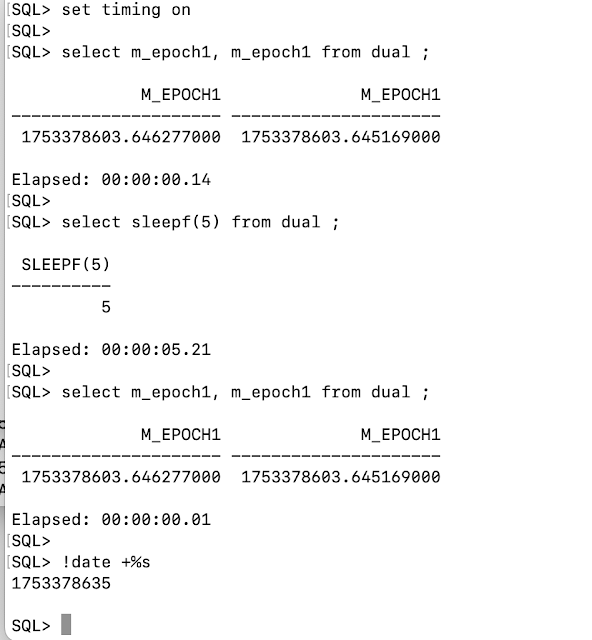
The usual test at the bottom of the source-script was a bit funny. The resulting values looked ok at first, close enough to the values from python time.time(), and close to my unix date +%s. But something didnt seem right. This is what my tests looked like:
The front-terminal shows a few queries using SELECT m_epoch1, and I tried the date-command straight away. The top-left terminal also shows the result from python. The value produced by python. At first sight, all looks reasonable.
The python value is typed about 6 sec after the linux-date. That was to be expected.
But the results from both of the SELECT queries show All The Same Values. And the values are about 140 seconds Older ??? (I did Not wait 2min in between....).
Something is Wrong...
I tried a more simple test: 2 identical selects with a deliberate sleep of 5 seconds in between, but the results, the epoch-values, of the 2nd run of the same query are Identical to the earlier call...
That Is Definitely Wrong.
Same epoch reported by 2 queries, 5 sec apart.. ?
I did several more test-queries, even comparing results from function and macro in the same query. A lot of results didnt make sense. I started noting...
Firstly, every query, every column, every call to the macro/function used to yield a slightly different value (as it did with the original function). But with the SQL Macro it does Not ??
Secondly, some query-results seem to remain constant over time. But not always...??
Thirdly, the values now seem to increase from Right to Left, where similar tests with the function-version, f_epoch, evaluated from Left to Right.
Fourthly, the values remain the same over the Rows of a query, e.g. subsequent rows do not seem to get later epoch-values, as they did with the function f_epoch.
Fifthly, I found that when re-run an Exact query, the same answers come out. E.g. it looks almost like there is a result-cache for the queries.. (I didnt have a result-cache configured, that I know of. I even checked, as I have presented and blogged on that result-cache topic back in .. ah .. 2016 - link)
All rather funny behaviour from the "macro" version.
I did several things: I started Reading the RTFM on SQL-MACROS (and the blogs by Tim Hall, sometimes dubbed as "The Better Manual"). And I asked some Oracle-Knowledgable Friends on slack about behaviour of SQL Macros. And within minutes, Erik van Roon, who has done several ppts on macros (link), had the clue...
The Solution: SQL MACROs are "injected" at parse time.
Erik's reply was: "If you get Constant-values from an SQL Macro, you do something Wrong. The Macro gets evaluated at Parse Time, and Only at Hard Parse."
My Lightbulb Moment...
That explained most of my funny results. The macro inserted a "constant" value at (hard) parse time. and that value, the epoch-time at hard-parse, remained with the query, until the next hard parse.
Tim even shows how you can do a. 10053 trace and see the query-after-the-macro. And in my case, my sloppy-written macro would "inject" the epoch-value written as a string representing the litteral number. And that litteral would stay their until the next hard-parse.
For my solution, I had to go back to the manual and learn how to properly write an SQL MACRO...
It is the q'[ Quotes ]', Stupid !
Here is how my good, Working, version looks now:
By returning the part in the q'[...]' it gets "injected" into the statement. And now the results are more promising.
Verify: Repeated, identical queries should return increasing, epoch-values:
Looks good. Now, every execute of a query gets a fresh epoch value.
Now Verify Atomicity: Multiple epoch-columns in a query should return same epoch-values for all calls to the epoch:
Correct! All epochs, regardless of row or column, have the same value.
And the fractional seconds show that the epoch corresponds to SYSTIMESTAMP for the query.
This is actually more like the behaviour that I would want from an epoch-function in SQL.
In short, I think we just Improved the Correctness for our Epoch.
Further research: Later...
So we improved on the "epoch", and I would recommend using the SQL Macro here whenever possible. ... Unless (like me sometimes) you were interested in some kind of "precision measurement" during the execution of the query.
Just let me show you this:
Every Row in this SQL does two calls to the function f_epoch, and also displays the value from m_epoch2 and the factional seconds from SYSTEMTIMESTAMP.
Notice how the values of m_epoch are slightly earlier than the values from f_epoch. The m_epoch got inserted at the start of the query, together with the timestamp. But the f_epoch values got added (called) as each row got produced, and are thus a little later. This gives us some insight into the processing of the query. Might be interesting for some research.
Maybe Later.
Speed Test: how long does it take...
As with the function-versions of the epoch, I did some testing with large-ish numbers of calls/records/queries.
I watermarked the SQL in the test with comments.. For example /* tm1.1 */ : It will query with 1 column-value of m_epoch, and get 1000-rows (connect by <1001)
And then tm1.2, tm1.3, tm1.4, tm1.8 : Ditto with 2, 3, 4 or 8 values in the row (more use of macro, more use of systimestamp...).
Those could be compared to similar calls to the f_epoch, the function from the previous blog, where I used tf1.1 and tf1.4.
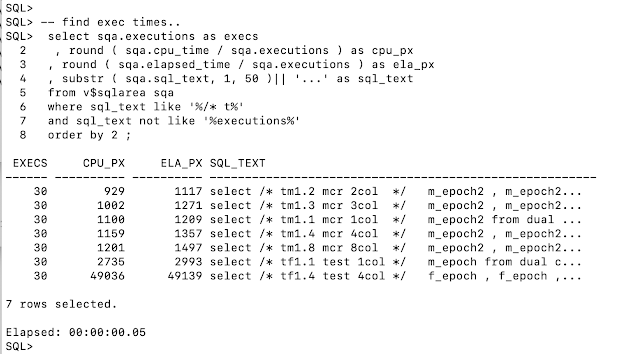
The results:
First look shows: the SQL Macro outperforms the function-call.
Even getting 8,000 epoch-values (1000 rows, 8 columns, /* tm1.8 */ ) using the macro, is faster than getting 1,000 values from the function in query /* tf1.1 */ ...
This makes sense: every f_epoch is a "separate call", whereas the m_epoch is inserted at the start of the query, and requires "no further calls".
Remember: we found about 8microsec per call to f_epoch, which still +/- concurs with the numbers in the results for /* tf1.1 */ and /* tf1.4 */ in this test.
The values for the queries using the macro for 1, 2, 3, 4 and 8 columns are so close together that I dont want to do any calculation on those yet.
There was however 1 consistent anomaly: it was strange that the 1-column resultset ( /* tm1.1 */ ) should consistently be slower than the queries with 2 or more columns. Later!
(the above test is done using script tst_epoch3.sql, link below)
Yep, The SQL Marco is Fast....
Just to dig a little further, I tested with more rows and columns.
I also tested with and without set termout-on/off: the termout had no impact on execution-times, but made my tests go smoother, because I didnt have to wait for the endless scrolling terminal.
Because the epoch-value seems too get "fixed" at (soft)parse time, and the number of epoch-columns seems to have little impact, I varied the number of rows as well, 1000, 2000, 4000, 8000 (test in script tst_epoch4.sql, link below):
Interesting, but somewhat expected: The number of Rows now determines the (cpu) time the query consumes. The fastest group of queries is the one with 1k-rows. Even if the 1000 rows contain 8 epoch-columns (test tm1.8.1), producing those 8000 epochs is a lot faster in 1000 rows, than it is in 8000 rows x 1 column: test tm1.1.8.
The blue line indicates the jump from 1k records to 2k records, and the first jump-increase in cpy_per_exec.
And notice that in general, the use of the SQL Macro is much faster, and more "scalable" due to a lot less activity, than the conventional function-calls from the earlier version of f_epoch.
Conclusion so far: That Macro Flies ! ( ... in this case)
About that anomaly... Parsing ?
In the process of testing, I accidentally found the (probable) cause of The Anomaly of the First Query: at the bottom of the timing-results we see the exec-time for a manually done, one-time SQL:
select / tm0 1st macro */ m_epoch from dual ;
This query appears on the last line of the test-results above, and it has only been called Once...
By doing that one-call, the First Call, to the macro (after shared-pool-flush, or after re-create), I seem to "prime" or Parse the SQL Macro. If I leave that out, the first query in the test-series takes much longer on the first run, and that affects the average for this query. This explained the anomaly for tm1.1 in the previous test...
Another Item "found", and something to inquire when I next meet People Who Know Much More then me..
Wrapping it up: The Macro is The Better Version.
About the SQL Macro: I think that In This Case, the use of the Macro is more appropriate than the function. Especially as I gave some warnings about "Atomicity" in the blog about the creating of the function (link). But if you want to measure "inside the statements", then the function-version is what you need.
The speed-tests show that the use of SQL Macro here also makes a difference.
The anomaly I found on "first call", and where I worked around with a manual one-macro-call query, is probably explicable, but I dont have the inclination to read- or dig-deeper on this Right now. Later.
I'll put links to the source files below so you can do your own replay of some of this.
Remember: the Best re-use of code is once you have typed it yourself...
Enjoy!
-- -- -- -- -- End of this blogpost, for now -- -- -- -- --
Appendix: Scripts.
mk_epoch_macro.sql : creation of the macro and some first-tests.
tst_epoch3.sql : testing to compare macro and function.
tst_epoch4.sql : testing with less and more rows.
-- -- -- -- -- End of this blogpost for Real -- -- -- -- --


No comments:
Post a Comment